
Figure 1.
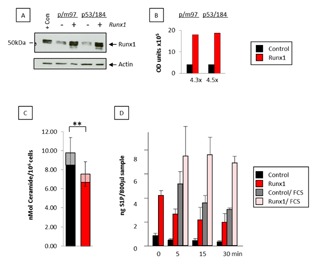
Ectopic Runx1 promotes S1P release from T‐lymphoma cells. (A) Total protein was extracted from p/m97 or p53/184 thymic lymphoma cells transduced with the pBabeRunx1 retroviral vector or the pBabePuro vector control and probed against antibodies to Runx1 (Cell Signalling #8229) or actin (Santa Cruz sc‐1616) as a loading control. Lymphoma cells over‐expressing Runx1 (9) were included as a positive control. (B) The blot was quantified using image J software and the Runx1 fold change indicated below the histogram. (C) Long chain ceramides were extracted from cell pellets from pBabePuro vector control and pBabeRunx1‐expressing T lymphoma cells (p/m97 shown), and separated, identified, and semi‐quantitated by HPLC mass spectrometry. The data are means ± SD where n = 4 from one experiment typical of two. Solid bars represent combined levels of 16.0, 24.1, and 24.0‐Cer (P = <0.01). A significant difference between ectopic Runx1 expressing and non‐expressing cells was preserved when the remaining ceramides (14.0, 16.1, 18.0, 20.0, 22.1, 24.2‐Cer—displayed in hashed bars) were included in the total (P = <0.01). (D) C18‐S1P was analyzed from conditioned media collected from pBabePuro vector control and pBabeRunx1‐expressing T lymphoma cells by HPLC mass spectrometry (p/m97 shown). FCS was included to activate Sphk1. The data are means ± SD where n = 4 from one experiment typical of two.