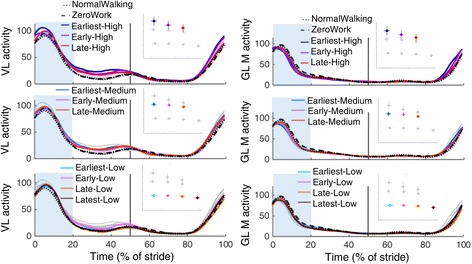
Fig. 10.

Electromyography of the m. vastus lateralis and m. gluteus maximus. Time series show population averages for EMG of the m. vastus lateralis (VL) and the m. gluteus maximus (GL M) averaged for the left and right leg and plotted from heel contact to heel contact. The grey vertical line represents opposite heel contact. All powered conditions are shown in grey, with selected conditions in color. Subplots at top show which conditions are shown in color. Blue rectangles show the periods where a peak EMG value was analyzed. Repeated measures ANOVA indicated significant differences between conditions for the EMG peak during the stance phase (between 1 and 62% of the stride; P = 0.05) for the m. vastus lateralis, but post-hoc t-tests with Šídák-Holm correction did not show any significant difference between the powered conditions and the NormalWalking condition or the ZeroWork conditon. Therefore, no regression analysis was done for this EMG metric. Repeated measures ANOVA indicated no significant differences between conditions for the EMG peak during the stance phase (between 1 and 62% of the stride; P = 0.95) for the m. gluteus maximus. Therefore, no regression analysis was done for this EMG metric
