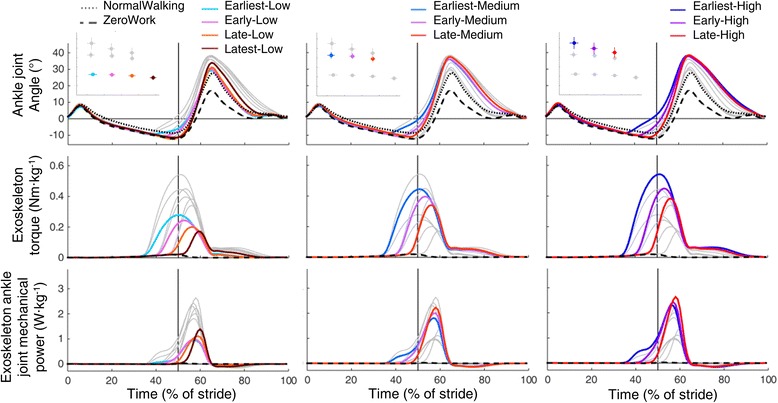
Fig. 3.

Ankle joint angle, exoskeleton torque and exoskeleton power. Population averages, normalized from heel contact to heel contact for ankle joint angle, exoskeleton torque and exoskeleton ankle joint mechanical power of the 10 powered conditions, the ZeroWork condition and the NormalWalking condition. All powered conditions are shown in grey, with selected conditions in color. Subplots at top show which conditions are plotted in color in each panel. The vertical grey line represents opposite heel contact
