
Fig. 8.
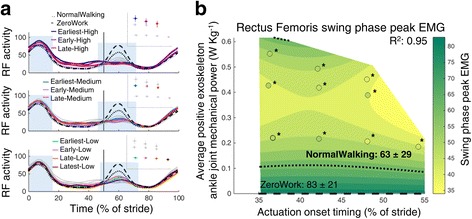
Electromyography of the m. rectus femoris. Time series show population averages for EMG of the m. rectus femoris (RF) averaged for the left and right leg and plotted from heel contact to heel contact (a). The grey vertical line represents opposite heel contact. All powered conditions are shown in grey, with selected conditions in color. Subplots at top show which conditions are shown in color. Blue rectangles show the periods where a peak EMG value was analyzed. No significant differences were found between conditions for the first EMG peak during the stance phase (between 1 and 62% of the stride; P = 0.23). Therefore, no regression analysis was done for this EMG metric. Repeated measures ANOVA indicated significant differences between conditions for the peak EMG around toe-off (between 40 and 80% of the stride; P < 0.001). The effect of actuation timing and exoskeleton power on peak EMG near toe-off (b) is indicated by a regression analysis. The surface gradient is the result of a two-dimensional regression for which R2 is provided (P < 0.001). The black dotted line shows the NormalWalking condition and the black dashed line shows the ZeroWork condition with the absolute value for both conditions. * indicates a statistically significant reduction versus ZeroWork and ** indicates a statistically significant reduction versus NormalWalking based on post-hoc t-tests with Šídák-Holm correction (P ≤ 0.05)