Figure 2.

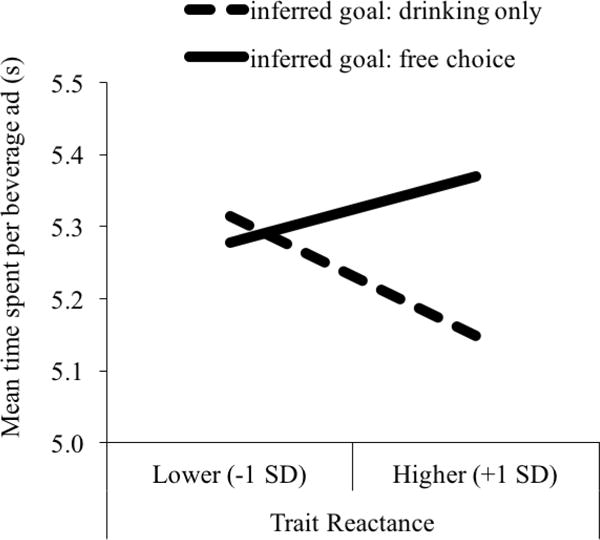
Mean time spent on ads as a function of participants’ goal inference condition (free choice vs. drinking only) and trait reactance (Study 1). Note the y-axis starts at five seconds.

Mean time spent on ads as a function of participants’ goal inference condition (free choice vs. drinking only) and trait reactance (Study 1). Note the y-axis starts at five seconds.