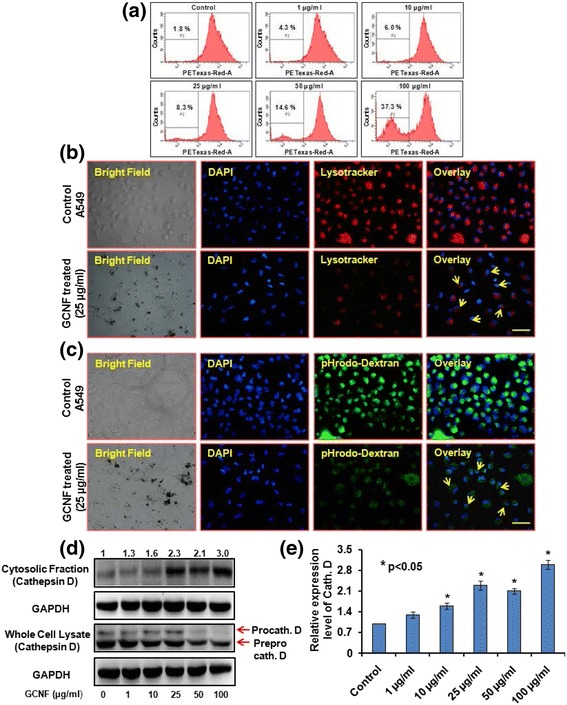
Fig. 6.

Representative flow cytograms and corresponding fluorescence photomicrographs showing (a) % reduction in acridine orange positive cells (b) reduced Lysotracker red staining (c) reduction in pHrodo dextran green fluorescence (marked with yellow arrows). Scale bar - 50 μm. Per view 50 cells and 4 views per group were analyzed. (d) Immunoblotting and (e) respective densitometry analysis of cytosolic release of cathepsin D in GCNF exposed cells. GAPDH was used as a loading control. Values are expressed as mean ± SE of three independent experiment. *p<0.05 was considered as statistical significant
