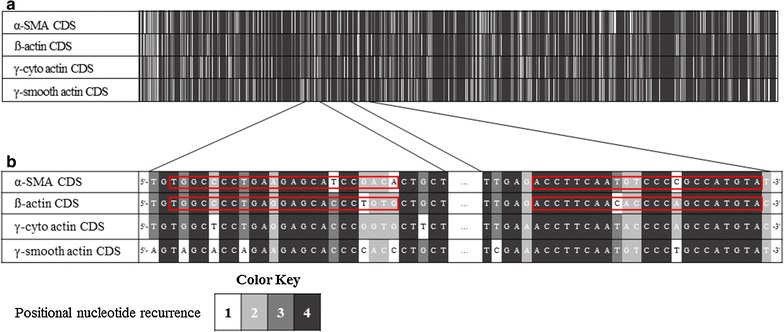
Fig. 1.

Heat map of nucleotide homology between CDSs of mouse α-SMA, ß-, γ-cyto- and γ-smooth-actin. Nucleotides were scaled from 1 to 4 individually according to their positional recurrence in the aligned CDSs of mouse α-SMA, mouse ß-actin, mouse γ-cyto-actin and mouse γ-smooth-actin (a). Priming sites of our mα-SMASD and mß-actinSD primer pairs are enlarged and highlighted with red boxes (b)
