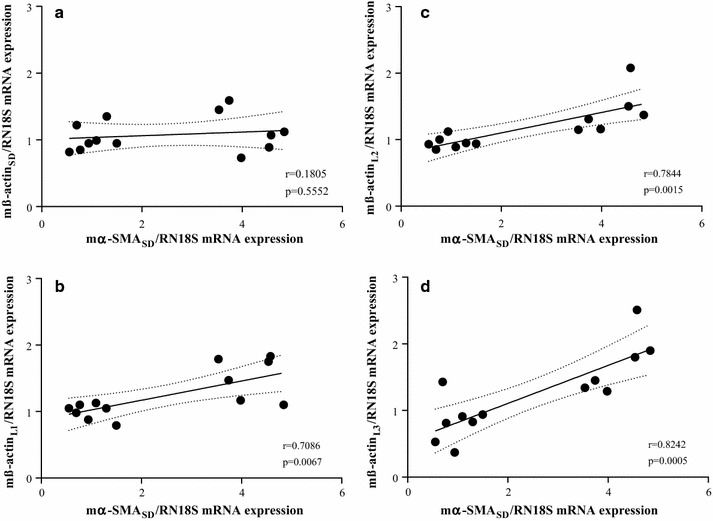
Fig. 10.

Correlation between relative α-SMA and ß-actin mRNA expression in mice kidneys. The relative ß-actin mRNA expressions measured by mß-actinSD (a), mß-actinL1 (b), mß-actinL2 (c) or mß-actinL3 (d) primer pairs were correlated with the relative α-SMA expressions measured by mα-SMASD for each samples
