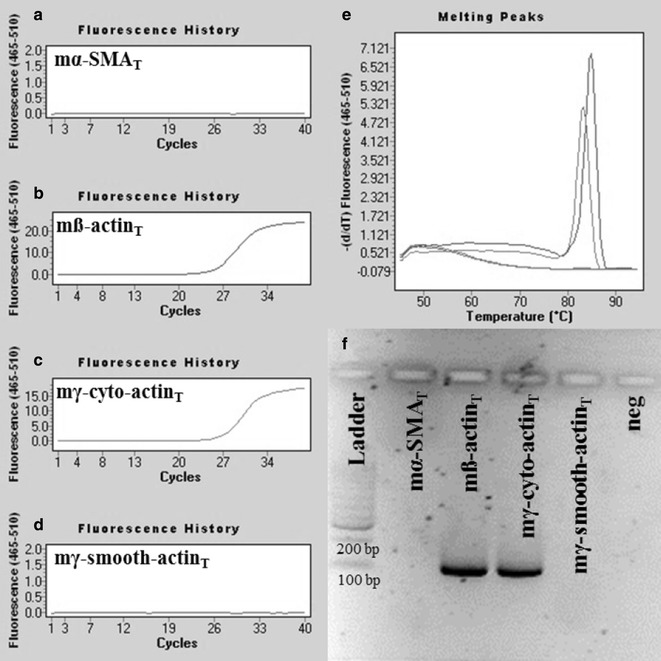
Fig. 3.

Representative plots of mouse ß-actin specific real-time PCRs. PCRs using mß-actinSD primer pair amplified mß-actinT (Ct = 15.76) and mγ-cyto-actinT (Ct = 26.94) DNA (b, c), but did not amplify mα-SMAT and mγ-smooth-actinT DNA fragments (a, d). Our mouse ß-actin PCR resulted in products with melting peaks at 84.8 and 83.3 °C (e) and a discrete band at 106 bp in agarose gel after electrophoresis (f)
