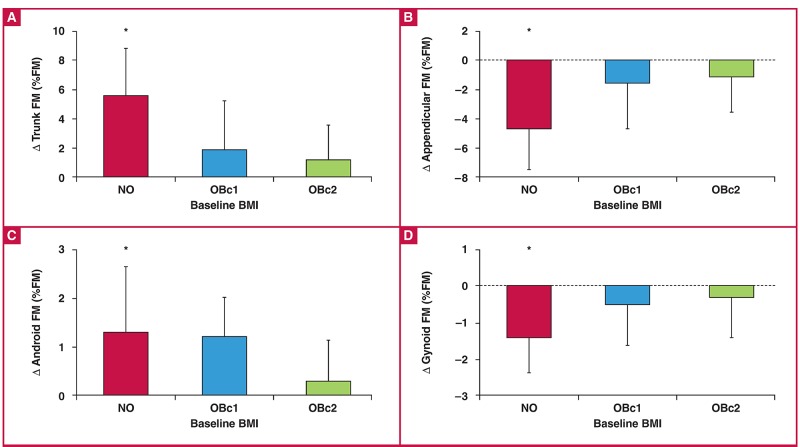
Fig. 3.
Changes in body fat distribution, expressed as a percentage of total fat mass (kg), in three baseline BMI groups. Data are represented as means ± standard deviation, FM; fat mass. Three BMI groups defined at baseline: NO:< 30 kg/m2, OBc1: 30–34.9 kg/m2 and OBc2: ≥ 35 kg/m2. *Change in NO group significantly different to both other BMI groups, p < 0.01 via Tukey post-hoc analysis.

