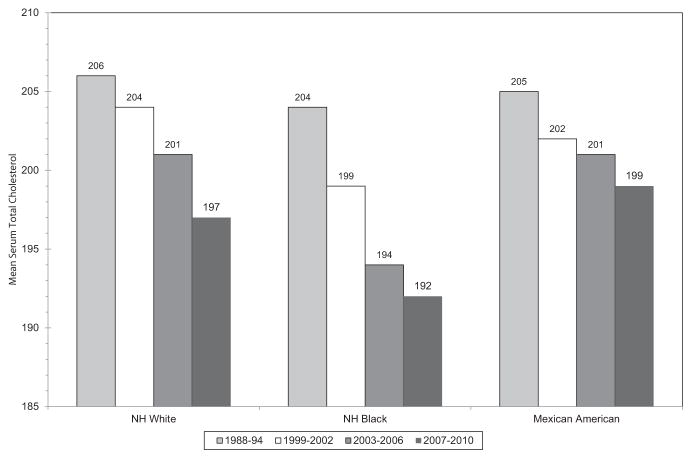
Chart 8-2.
Trends in mean total serum cholesterol among adults ages ≥20 years old by race and survey year (National Health and Nutrition Examination Survey: 1988–1994, 1999–2002, 2003–2006, and 2007–2010). Values are in mg/dL. NH indicates non-Hispanic. Source: National Center for Health Statistics and National Heart, Lung, and Blood Institute.

