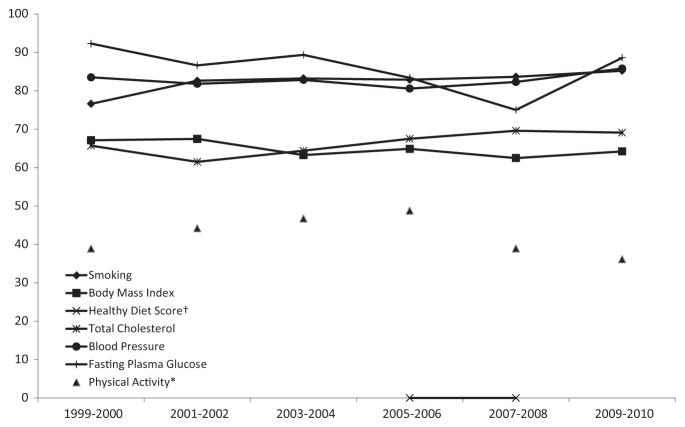
Chart 2-8.
Trends in prevalence (unadjusted) of meeting criteria for Ideal Cardiovascular Health, for each of the 7 metrics of cardiovascular health in the American Heart Association 2020 goals, among US children aged 12 to 19 years, National Health and Nutrition Examination Survey (NHANES) 1999–2000 through 2009–2010*† (available data as of June 1, 2012). *Due to changes in the physical activity questionnaire between different cycles of the NHANES survey, trends over time for this indicator should be interpreted with caution and statistical comparisons should not be attempted. †Data for the Healthy Diet Score, based on a 2-day average intake, was only available for the 2003–2004, 2005–2006, and 2007–2008 NHANES cycles at the time of this analysis.

