
Figure 2.
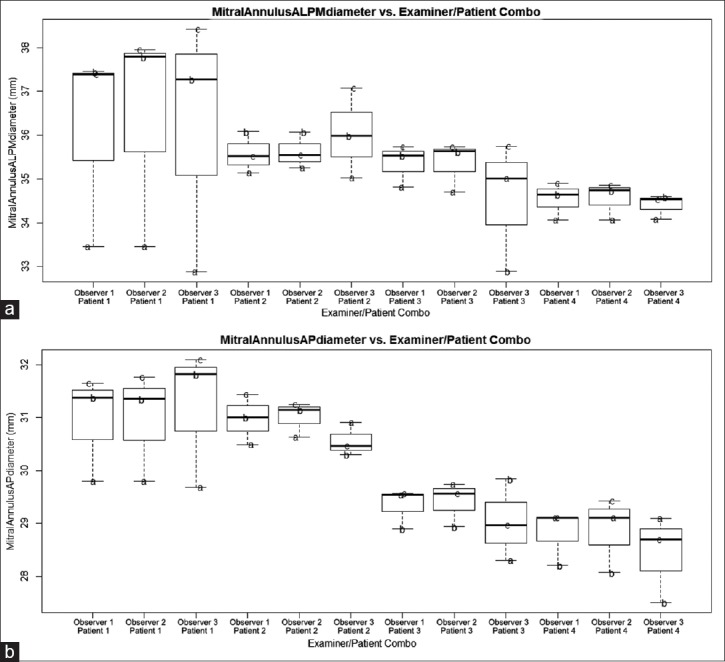
Plot of anterolateral posteromedial (panel A) and anteroposterior (panel B) diameter against examiner/patient combination. Overlaid text letters (a and b) denote different loop selections for each particular patient
Official websites use .gov
A
.gov website belongs to an official
government organization in the United States.
Secure .gov websites use HTTPS
A lock (
) or https:// means you've safely
connected to the .gov website. Share sensitive
information only on official, secure websites.
Plot of anterolateral posteromedial (panel A) and anteroposterior (panel B) diameter against examiner/patient combination. Overlaid text letters (a and b) denote different loop selections for each particular patient