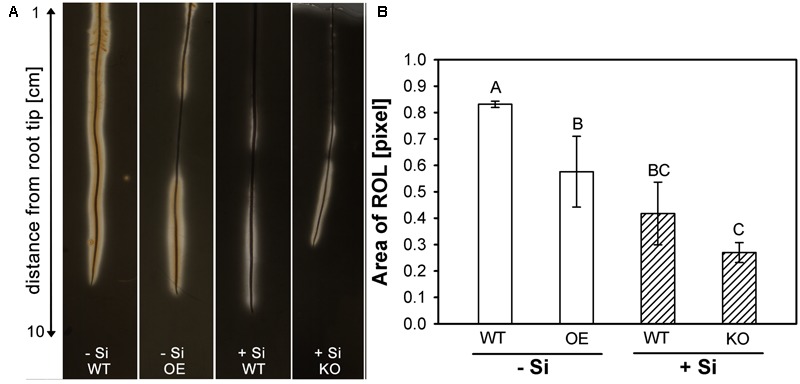
FIGURE 4.

(A) Visualization of radial oxygen loss (ROL) from rice roots using a FeS-agar. The WT plants were grown with low (–Si) and high (+Si) Si supply (conc. are given in the legend of Figure 1), whereas the insertion line 1B-14436 (KO) was cultivated only in + Si and mutant 3A-16329 (OE) only in –Si; (B) Area of ROL of roots of WT plants and the mutation lines 1B-14436 (KO) and 3A-16329 (OE). Different letters indicate a significant difference between treatments; Tukey test with p < 0.05.
