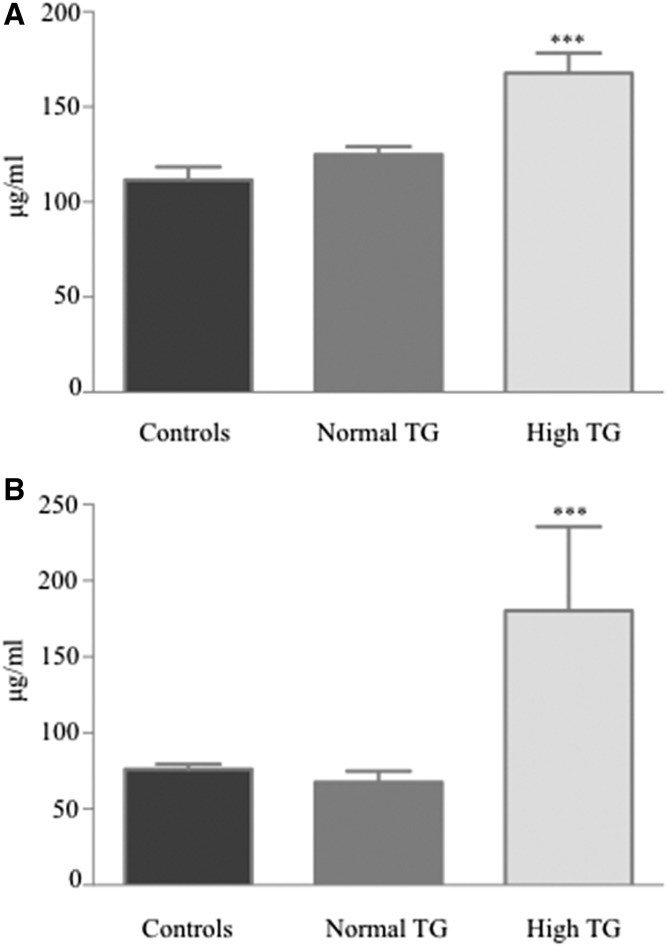
Fig. 2.
Plasma levels of Apos (C-II and C-III) in controls and in ALL survivors with and without hypertriglyceridemia. Concentrations of Apo C-II (A) and Apo C-III (B) were measured by commercial ELISA kits in n = 22 healthy controls, n = 67 in ALL survivors with normal TGs, and n = 13 in ALL survivors with high TGs. ***P < 0.001 versus controls.

