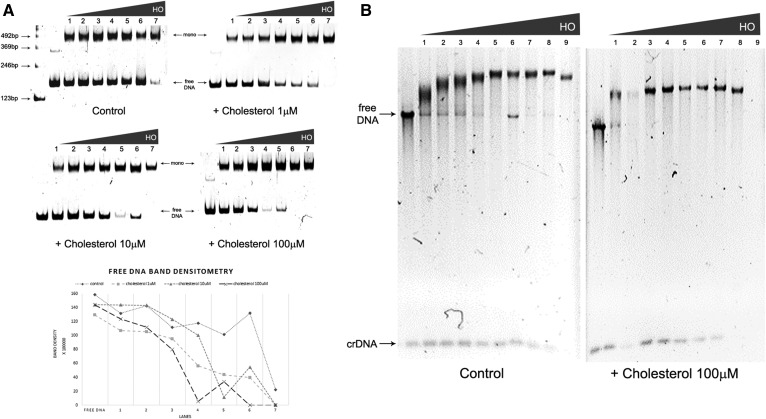
Fig. 1.
Effect of cholesterol on nucleosomes and chromatin fibers reconstituted in vitro. A: Mononucleosome formation: Chicken HO titration (1 = 1.3 μM; 2 = 1.5 μM; 3 = 1.8 μM; 4 = 2.0 μM; 5 = 2.2 μM; 6 = 2.5 μM; 7 = 2.7 μM) in the absence (control) or presence of increasing cholesterol concentration (1, 10, and 100 μM) analyzed by EMSA in acrylamide gel 6%. DNA: 167.1. Gels were run under the same experimental conditions; free DNA band densitometry graph of upper gels; B: Chromatin fiber formation: Chicken HO titration (1 = 2.0 μM; 2 = 2.2 μM; 3 = 2.5 μM; 4 = 2.7 μM; 5 = 2.9 μM; 6 = 3.1 μM; 7 = 3.4 μM; 8 = 4.0 μM; 9 = 4.7 μM) in the absence (control) or presence of cholesterol (100 μM), analyzed by EMSA in agarose gel 0.8%. Array: 177.36. Gels run under the same experimental conditions. Legend: crDNA, competitor DNA. All gels are representative of three separate experiments.

