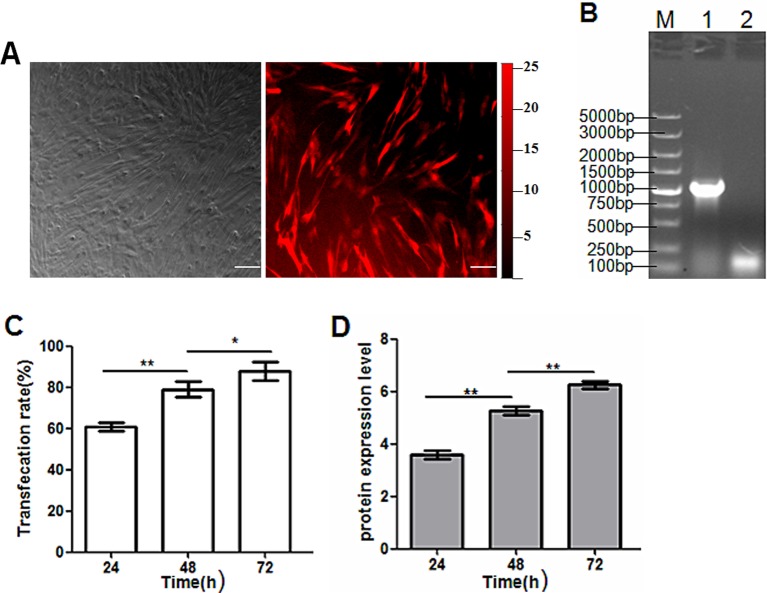
Figure 5. MSCs infected with recombinant AAV vectors.
(A) Fluorescence microscopic image of iRFP expression in MSCs (bars: 20 μm). (B) Electrophoresis result of touchdown PCR products of DNA from infected MSCs. Lane M: DNA ladder; lane 1: touchdown PCR products of DNA from infected MSCs; lane 2: touchdown PCR products of DNA from non-infected MSCs. (C) pAAV-iRFP682-TRAIL transfection rate after 24, 48 and 72 h. (D) TraiL protein expression levels at 24, 48 and 72 h.

