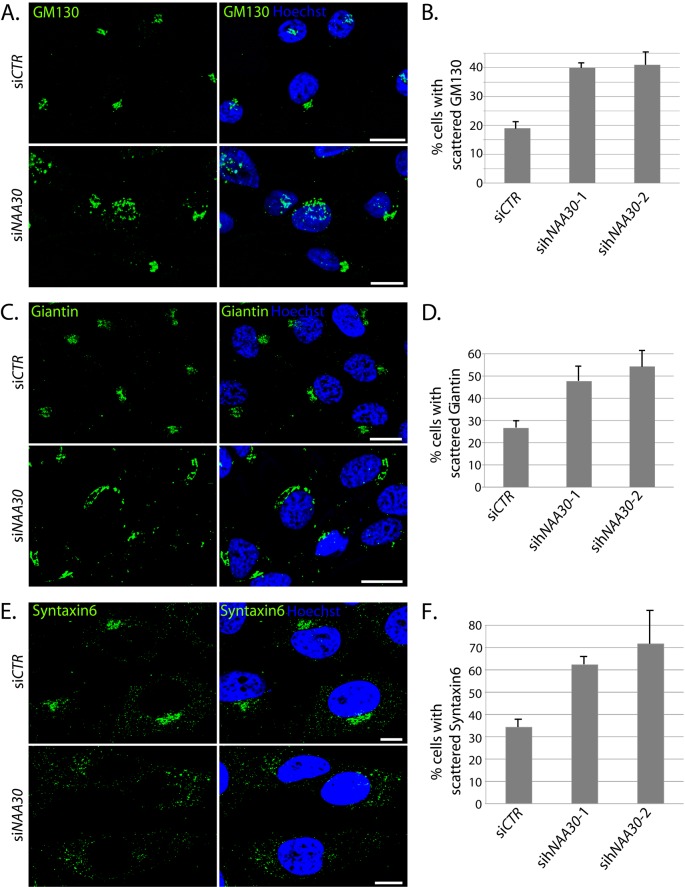
Figure 2. sihNAA30-treated HeLa cells display scattered cis-Golgi and TGN.
HeLa cells were depleted for hNaa30, immunostained for cis-Golgi markers GM130 (A), Giantin (C) or TGN marker Syntaxin6 (E) and analysed by immunofluorescence microscopy. The percentage of cells with scattered appearance of GM130 (B), Giantin (D) or Syntaxin-6 (E) was calculated for each sample. For GM130 and Giantin, pictures were treated with 3D de-convolution and stacks were Z-projected to visualize GM130 and Giantin appearance. Images for Syntaxin6 are confocal micrographs. Hoechst 33342 was used to visualize the nuclei. White bars (A,C and E) indicate 10 μm. At least 100 cells were counted in at least three independent experiments for all the markers. The difference in % cells with scattered phenotype between siCTR and siNAA30 siRNA was statistically significant based on the Student’s t test, with P<0.05. Error bars indicate S.D.

