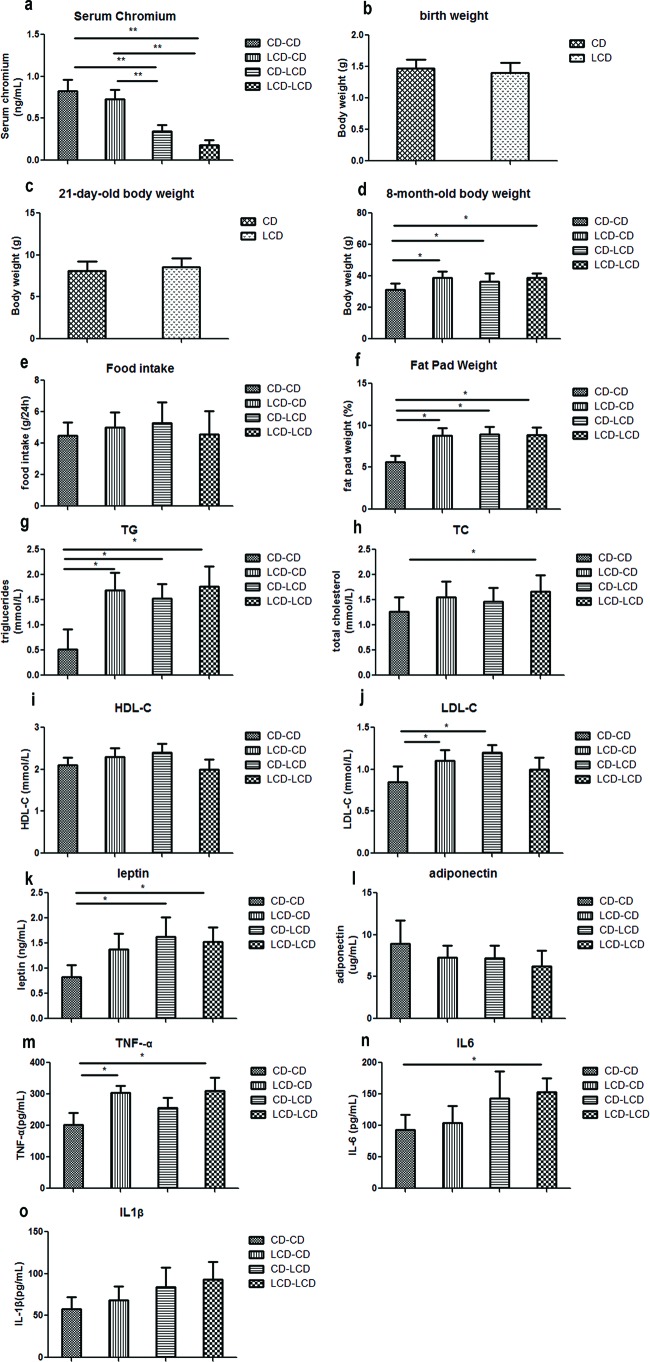
Figure 2. Metabolic indicators affected by maternal low chromium diet.
Serum chromium level (a) at 8 months of age in offspring, birth weight (b), weaning weight (c), and body weight (d), food intake (e), fat pad weight (f), serum TG (g), TC (h), HDL-C (i), LDL-C (j), leptin (k), adiponectin (l), TNF-α (m), IL-6 (n) and IL-1β (o) at 8 months of age in offspring. Values are mean ± S.D. (n=8); *P<0.05, ** P<0.01.

