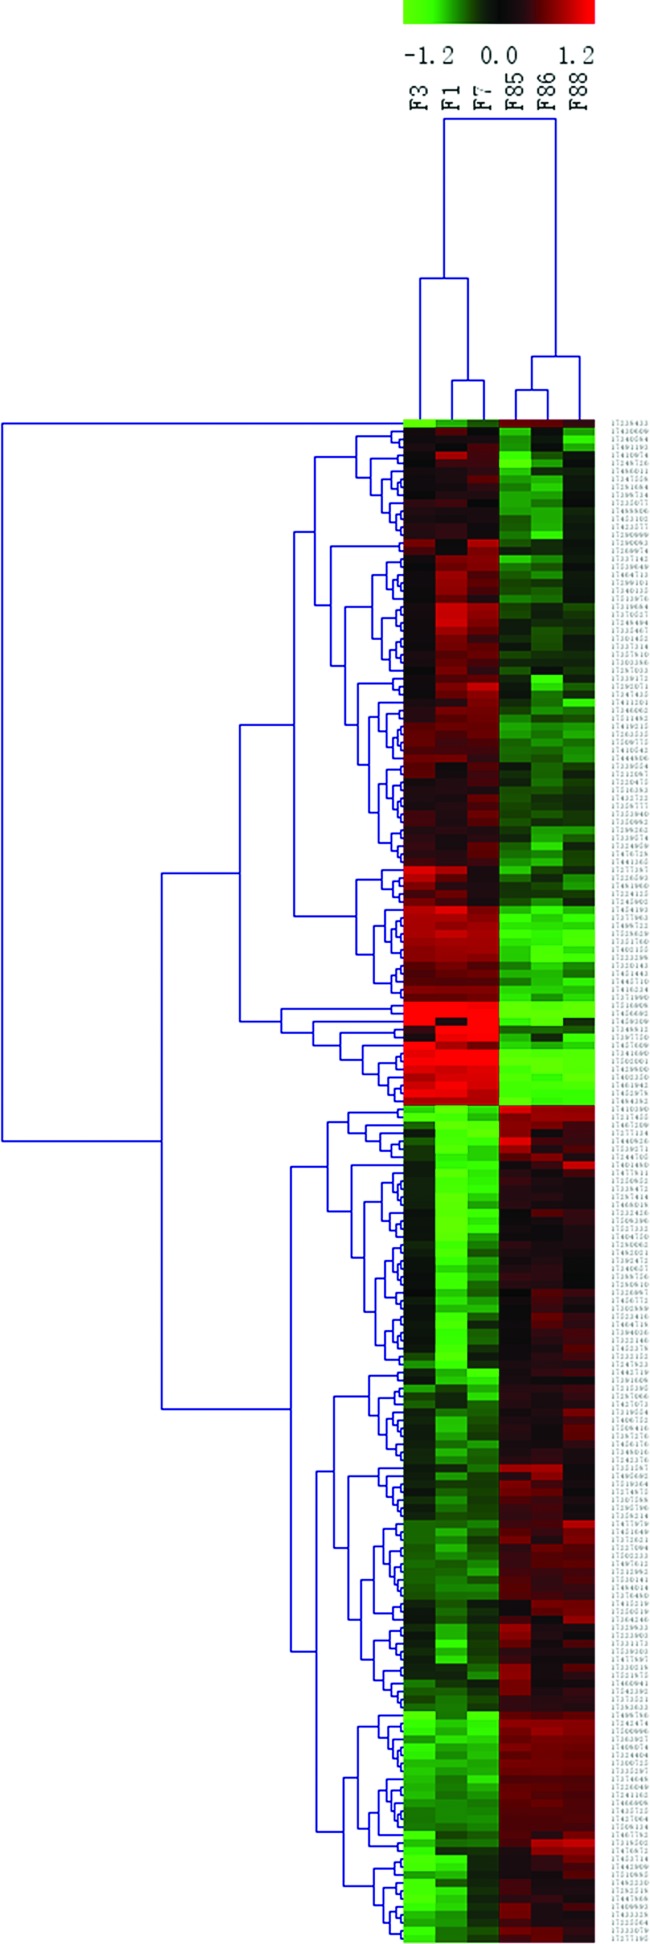
Figure 3. Hierarchical clustering of differently expressed genes between LCD-CD group and CD-CD group.
Hierarchical clustering of the 1.5-fold up-regulated and down-regulated genes. ‘Red’ indicates high relative expression; ‘green’ low relative expression.
Samples F1, F3, F7 belong to LCD–CD group; samples F85, F86 and F88 belong to CD–CD group.

