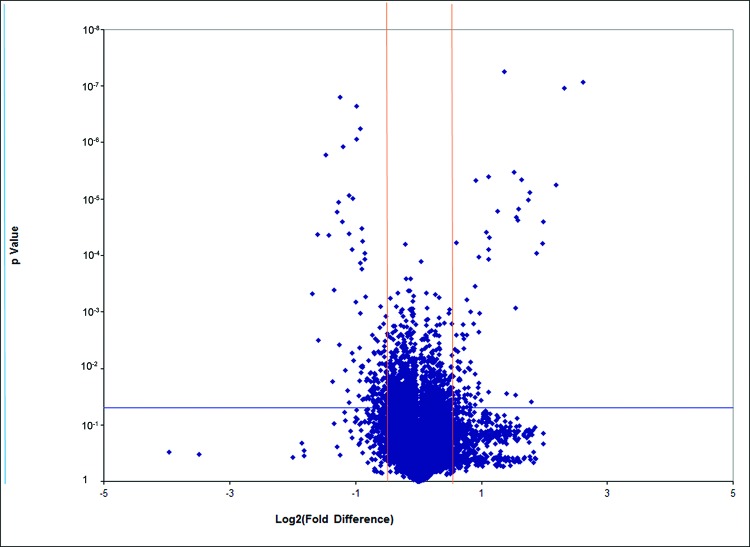
Figure 4. Volcano Plot of all genes in gene array (LCD-CD group vs CD-CD group).
Volcano plot of genes in gene array. The red lines represent 1.5-fold up- and down-regulation and the blue line shows a P-value of 0.05. The dots in right block above the blue line are up-regulated genes; the dots in left block above the blue line are down-regulated genes.

