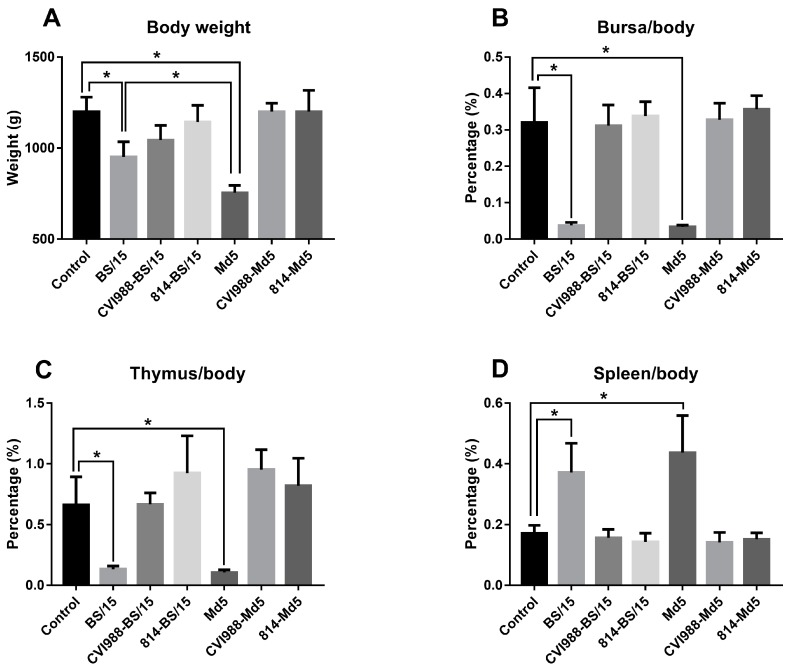
Figure 4.
Body weights and ratios of immune organ weight/body weight in the surviving chickens of each group. The data are shown as mean with SD (n = 2 in the BS/15-challenged group, and n = 3 in the Md5-challenged control group, whereas n = 5 in the other groups), and differences were considered to be statistically significant at p < 0.05 (*). (A) Body weights of the surviving chickens in each group; (B) Ratios of bursa weight/body weight in the surviving chickens of each group; (C) Ratios of thymus weight/body weight in the surviving chickens of each group; (D) Ratios of spleen weight/body weight in the surviving chickens of each group.

