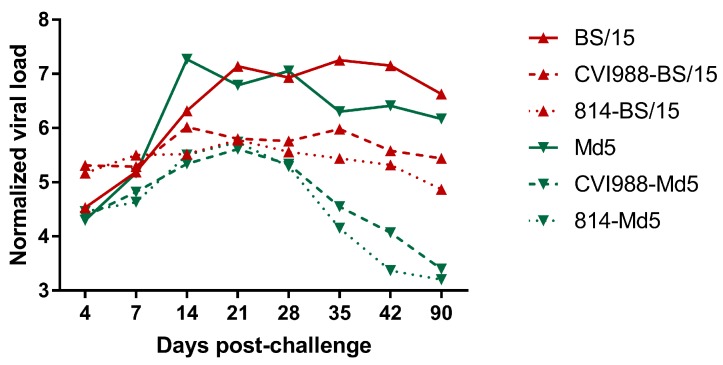
Figure 5.
Normalized viral loads in the feather pulps of five birds from the various treatment groups at different time points (n = 2 in the BS/15-challenged group, and n = 3 in the Md5-challenged control group at 90 days post challenge; dpc). Normalized viral loads were calculated as the logarithm of the MDV copy numbers per million cells.

