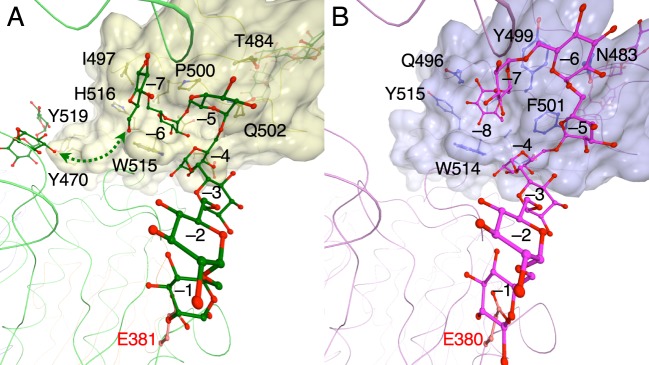
Figure 6. Structural comparison between the PsCITase–CI-7 complex and the PaCITase–IG-8 complex.
(A) PsCITase–CI-7 complex. (B) PaCITase–IG-8 complex [10]. Figures are viewed from the catalytic site. The bound sugars are shown by ball-and-stick models. CBM35 domains are shown in surface model and the Cα-trace of the catalytic domain is shown by wire drawings.

