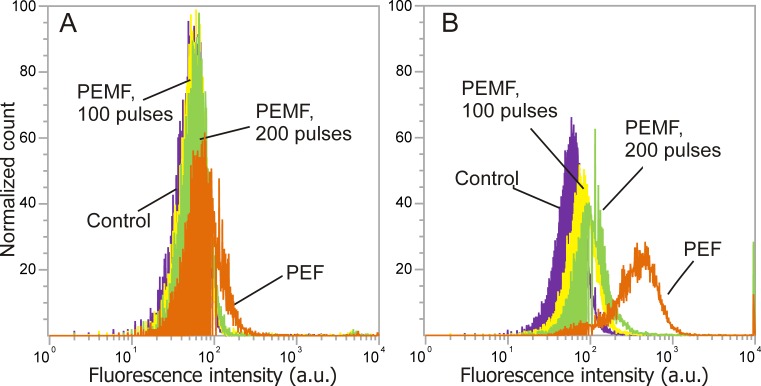
Figure 4. The dependence of fluorescence intensity spectra (PI, YP) on the treatment parameters.
After pulsed treatment a shift of fluorescence spectra was detected indicative of membrane permeabilization, where (A) PI assay; (B) YP assay; violet, untreated control; yellow, 50 × 2, 5.5 T PEMF; green, 50 ×4, 5.5 T PEMF; orange, PEF (1 × 100 µs, 1.2 kV/cm).

