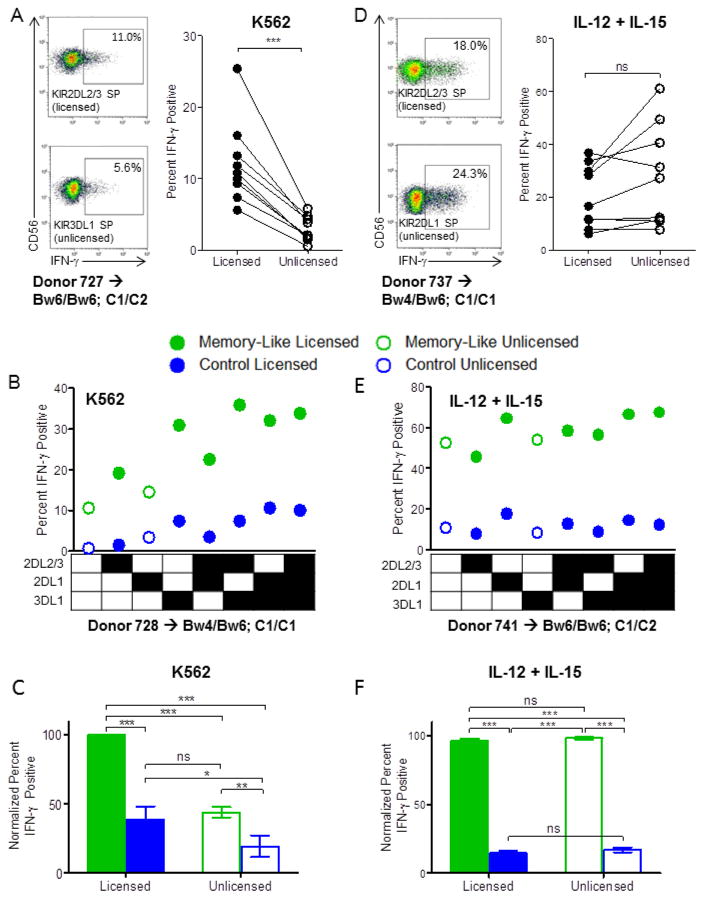
Figure 1. Cytokine pre-activation enhances the functional response of both licensed and unlicensed NK cells to leukemia targets or cytokine re-stimulation.
(A and D) Naïve PBMC were stimulated with K562 leukemia target cells (A) or IL-12 + IL-15 (D) for 6 hours after which IFN-γ protein levels were assessed via intracellular flow cytometry. Representative data showing the percentage of IFN-γ positive cells from select licensed vs. unlicensed NKG2A−CD56dim NK cell subsets, as well as summary data of all IFN-γ positive licensed vs. unlicensed NKG2A-CD56dim NK cells from n=9 normal donors are shown (n=7 independent experiments). (B, C, E, F) Memory-like or control NK cells were generated from PBMC as described in Methods and re-stimulated with K562 tumor targets (B, C) or IL-12 + IL-15 (E, F) for 6 hours. (B) and (E) show the IFN-γ response of the different NKG2A−CD56dim NK cell subsets according to KIR expression from representative donors in response to K562 targets (B) or cytokines (E). Summary data of the normalized mean ± SEM IFN-γ response of licensed vs. unlicensed memory-like or control NK cells from n=8 normal donors (n=6 independent experiments) to K562 targets (C) or cytokines (F) is also shown. Normalization was performed due to expected inter-individual differences in absolute IFN-γ percentages: for each donor, data were normalized to the NK cell subset (memory-like/licensed, memory-like/unlicensed, control/licensed, control/unlicensed) with the highest IFN-γ response, which was set at 100%. Memory-like NK cells = green, control NK cells = blue. Closed circles and bars = licensed NK cells, open = unlicensed NK cells. HLA-B and -C type is indicated for each representative donor. *p<0.05, **p<0.01, ***p<0.001.

