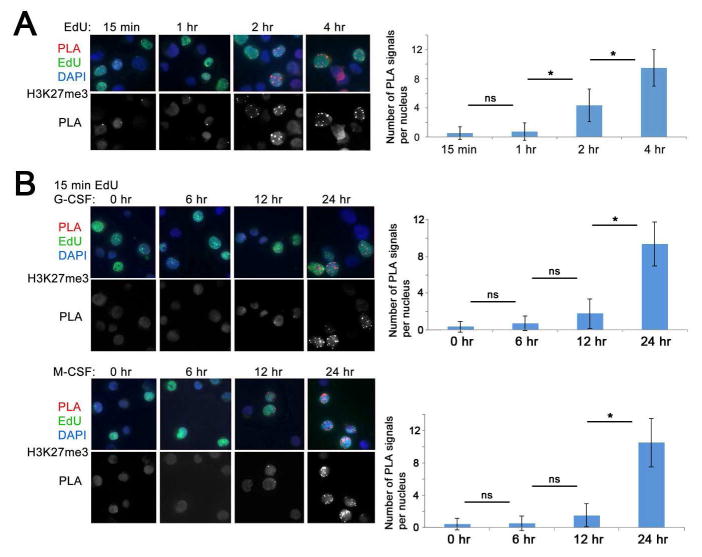
Figure 1. Kinetics of H3K27me3 accumulation following DNA replication in cytokine-treated CD34+ HPCs.
(A) Left, accumulation of H3K27me3 on nascent DNA of G-CSF-mobilized CD34+ HPCs. DNA was labeled with EdU for 15 min and chased to 1, 2 and 4 hr. Following conjugation with biotin, CAA was performed between nascent DNA (biotin) and H3K27me3. PLA, red, EdU (biotin), green, DAPI, blue. Lower panels show PLA signals only. Right, quantification of the results of CAA experiments shown to the left by counting the number of PLA signals per EdU-labeled nuclei in 50 cells/each of the three independent experiments.
(B) Left, accumulation of post-replicative H3K27me3 during differentiation of CD34+HPCs. Cells were induced for myeloid differentiation with either G-CSF (upper panels) or M-CSF (lower panels) for 0, 6, 12 and 24 hr. DNA was labeled with EdU for 15 min and CAA performed between EdU (biotin) and H3K27me3. PLA, red, EdU (biotin), green, DAPI, blue. Lower panels show PLA signals only. Right, quantification of the results of CAA experiments shown to the left by counting the number of PLA signals per EdU-labeled nuclei in 50 cells/each of the three independent experiments. Error bars represent +/− standard deviation. p Values were determined by ANOVA. ns, non-significant; *, p<0.05.

