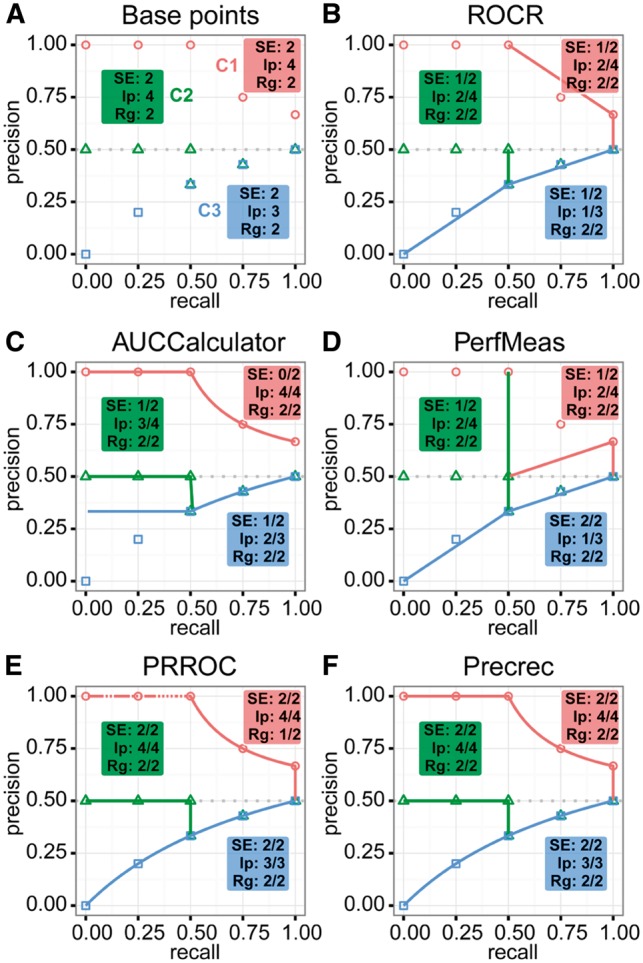
Fig. 1.

Results of evaluating precision–recall curves calculated by five different tools for three test sets – C1, C2 and C3. (A) The plot shows manually calculated points for C1 (red), C2 (green) and C3 (blue). Each test set contains three different test categories: SE (start and end positions), Ip (intermediate position and interpolation) and Rg (x and y ranges). In addition, each category has 3–5 individual test items. The remaining plots show the calculated curves with successes/total per category for (B) ROCR, (C) AUCCalculator, (D) PerfMeas, (E) PRROC and (F) Precrec
