
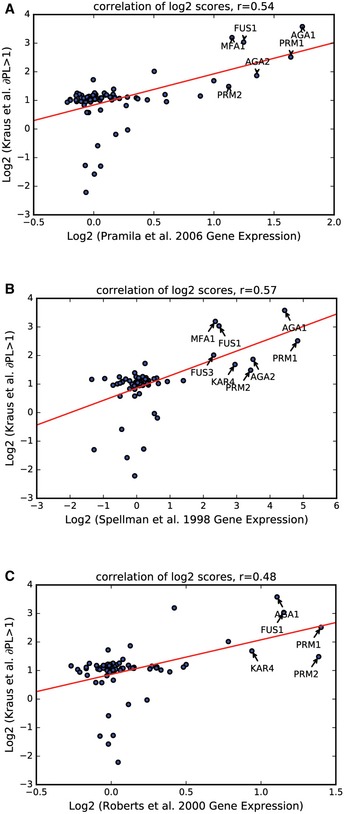
Figure EV2. Correlation of protein abundance measurements with gene expression data in response to α‐factor treatment.
-
A–CIn these plots, only proteins with ∂PL > 1 in at least one time‐point are compared to corresponding gene expression changes from three different data sources. In each instance, genes demonstrating a substantial increase in expression as well as protein abundance are indicated on the plots. Comparison to gene expression microarray data from (A) Pramila et al (2006), (B) Spellman et al (1998), and (C) Roberts et al (2000).