
Figure 3. Characterization of the tetrathionate‐sensing TCS, TtrS/R (Sbal195_3859/8).
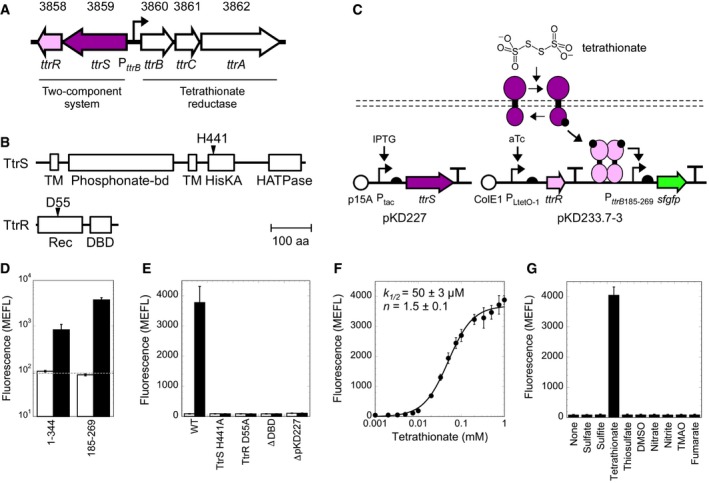
- Location of the thiosulfate sensor, consisting of TtrS (Sbal195_3859) and TtrR (Sbal195_3858), and tetrathionate reductase, TtrBCA (Sbal195_3860‐2), on the chromosome of Shewanella baltica OS195.
- Predicted domain architecture of TtrS and TtrR with the phosphotransfer residues indicated with an arrow. Domains are labeled by their Pfam family names. A scale bar is included for reference.
- Schematic of tetrathionate‐induced activation and plasmid design of the aTc‐ and IPTG‐inducible TtrSR components.
- Tetrathionate‐induced sfGFP production of the optimized truncated promoter PttrB185‐269 compared to the full‐length intergenic region PttrB344 in the presence (black bars) and absence (white bars) of 1 mM tetrathionate. The dotted horizontal line indicates cellular autofluorescence.
- Tetrathionate‐induced sfGFP production in the presence (black bars) and absence of 1 mM tetrathionate of wild‐type and inactivated sensors.
- Tetrathionate dose–response of the optimized promoter (closed circles).
- Selectivity of TtrS/R to tetrathionate over other terminal electron acceptors. All ligands were tested at 10 mM concentration.