
Fig. 1.
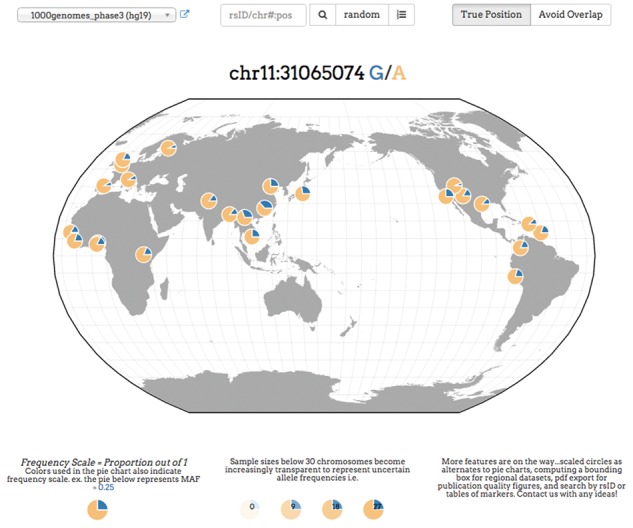
Example screenshot from the Geography of Genetic Variants browser using The 1000 Genomes Project Consortium (2015) data. Each pie chart represents a population with the blue slice of the pie displaying the frequency of the global minor allele