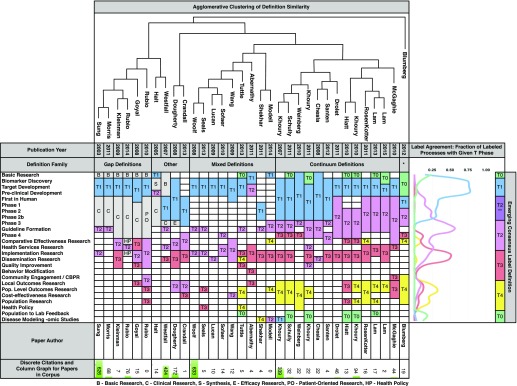
Fig. 2.
Primary review results with consensus, clustering, and total citation information. The center of the figure shows the results of primary definition labeling. Blank cells indicate that the particular paper did not mention that research activity. Target development includes 3 named activities that were categorized the same by all papers (target validation, lead optimization, and lead development). The top of the figure shows a dendrogram representing the results of agglomerative clustering on the activity categories, resulting in 3 main definition families and a set of outliers (the “Other” grouping and Blumberg on the right), and also defines the order of papers for presentation. The far right side of the figure includes a consensus categorization and graph showing the frequency of assignment of each process to each T-phase as a fraction of all papers in the corpus. Early clinical trial phases are labeled as mixed T2**. Although historic majority labeling is T1, since 2010 the predominant and emerging consensus label for these processes is T2. Citation counts for each paper are included below as a bar graph overlaid with the actual citation count for each paper.

