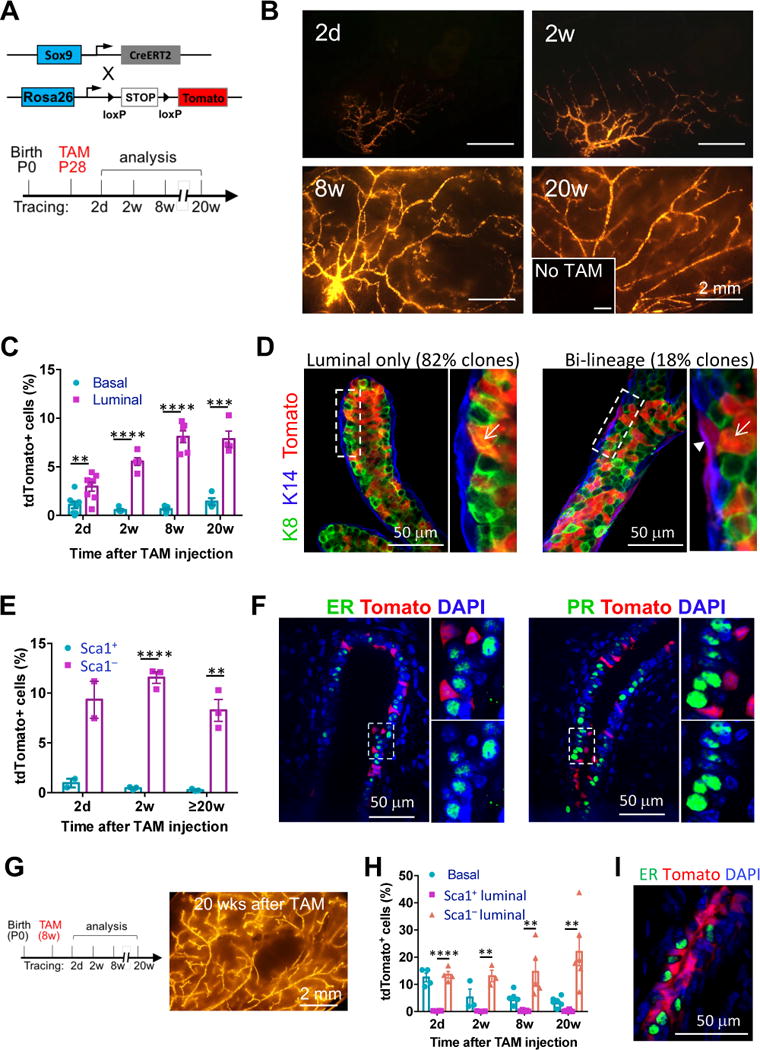
Figure 1. SOX9+ cells are long-term repopulating and maintain the ER− luminal and basal lineages in the postnatal mammary gland.

(A) The mouse models (upper) and the experimental schedule (lower) for lineage-tracing experiments shown in Figure 1B to 1F.
(B) Representative tdTomato whole-mount images of Sox9-CreERT2; R26R-tdTomato mammary glands at the indicated time points after tamoxifen treatment. Mice without tamoxifen treatment (No TAM) at 24 weeks of age were used as the negative control (inset). Minimum 3 animals were examined for each time point.
(C) Percentages of tdTomato+ cells in the basal and luminal populations at the indicated time points, as determined by flow cytometry (mean ± SEM, n = 3–8).
(D) K8 and K14 immunostaining of mammary gland sections for characterizing the tdTomato+ cells after 20 weeks of lineage tracing. Representative luminal only and bi-lineage tdTomato+ ducts are shown. The arrow head and arrows point to basal and luminal cells, respectively. Total 57 tdTomato+ cell clusters in 3 mice were counted.
(E) Percentages of tdTomato+ cells in the Sca1+ and Sca1− luminal populations at the indicated time points, as determined by flow cytometry (mean ± SEM, n = 2–3).
(F) ER and PR immunostaining of mammary gland sections 2 weeks after tamoxifen treatment. Magnification of the selected areas is shown on the right of each panel. 98% of tdTomato+ cells were ER− and PR−.
(G) Experimental schedule (left) for adult Sox9-CreERT2 lineage-tracing experiments as shown in Figure 1G to 1I, and a representative tdTomato whole-mount image (right) of Sox9-CreERT2; R26R-tdTomato mammary glands 20 weeks after the tamoxifen treatment.
(H) Percentages of tdTomato+ cells in the basal, Sca1+ and Sca1− luminal populations at indicated time points after the tamoxifen treatment, as determined by flow cytometry (mean ± SEM, n = 3–6).
(I) ER immunostaining of mammary glands after 20 weeks of lineage tracing of adult SOX9+ cells. 99.5% tdTomato+ cells were ER−.
*P < 0.05, **P < 0.01, ***P<0.001, and ****P < 0.0001.
See also Figure S1.
