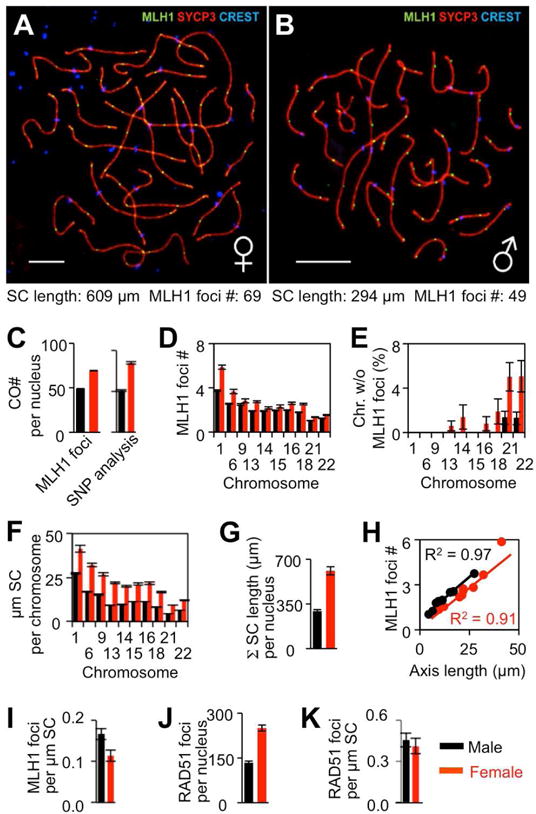
Figure 2. Analysis of male and female COs and SCs.

(A,B) Surface spread of pachytene bivalents in human primary oocyte (A) and spermatocyte (B). SC-linked axes are Immunostained by axis marker SYCP3, CO-diagnostic foci by MLH1 and centromeres by CREST. Scale bars, 10 μm. (C–K) Comparisons of chromosome features in males (black) and females (red). Bars = Standard Error (SE) in (C–G, J) and 95% confidence intervals in (I, K). p-values for male/female differences in (C–J) are <0.001, one-tailed, except in (D) p=0.06 for chromosome 9 and p=0.004 for chromosome 15. p=0.35 (K). p-values determined by Mann-Whitney test for (C), (D), (F), (G), (J); Fisher’s Exact test for (E); Pearson correlation test for (H) and from confidence intervals in (I, K). Data sources, sample sizes and further details of statistical analysis are given in STAR Methods. See also Figure S1.
