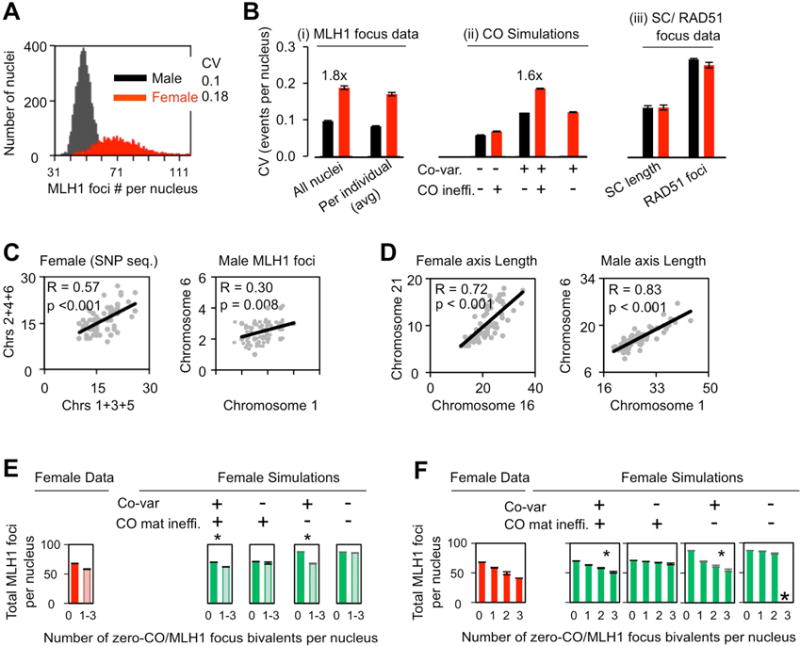
Figure 5. Variation in the total number of COs per nucleus.

(A,B) Nucleus-to-nucleus variation in total CO levels is greater in female (red) versus male (black) due to global co-variation plus female-specific CO maturation inefficiency as defined by Coefficients of variation (CV). (A; B(i, left)) CVs of MLH1 foci per nucleus as defined for all nuclei taken together. (B(i, right)) Average CVs for each sex: CVs of total COs per nucleus were determined for all nuclei from each of 57 males and, separately, from 62 females. (B (ii)) CVs of total COs per nucleus (all individuals) were predicted by simulations under indicated conditions (text; STAR Methods). (B (iii)) CVs of total SC lengths per nucleus and total number of RAD51 foci per nucleus. (B): Bars = SE. Significances of male/female differences: (B (i left) p<0.001 (likelihood ratio test); (B (i right)) p<0.001 (t-test). (B (iii): For SC length, p=0.377; for RAD51 foci, p=0.61 (likelihood ratio tests). (C, D) (C, D) Co-variation of CO numbers (C), or SC lengths (D), on two different chromosomes (or comparable groups of chromosomes) within individual nuclei (Pearson correlation, one tailed). (E, F). Tendency of zero-CO bivalent(s) to occur in female nuclei with a lower total number of COs (E left); progressive clustering of multiple zero-CO bivalents in a single nucleus is correlated with a progressive decrease in the total number of COs per nucleus (F left). Simulations show that these differences are attributable to global regulation of CO levels whereas CO maturation inefficiency is not significantly involved (E right; F right). The goodness of fit of each simulated data set to experimental data was defined by SSDs: (E) Left to right: SSD=101, 62, 6, 432, 2. (F) Left to right: SSD=244, 124, 12, 439, 17; underlining marks cases with significant match (also see small asterisks). Large asterisk = no cases in 5000 nuclei. (A–F): data sources, sample sizes and further details of statistical analysis in STAR METHODS. See also Figure S6.
