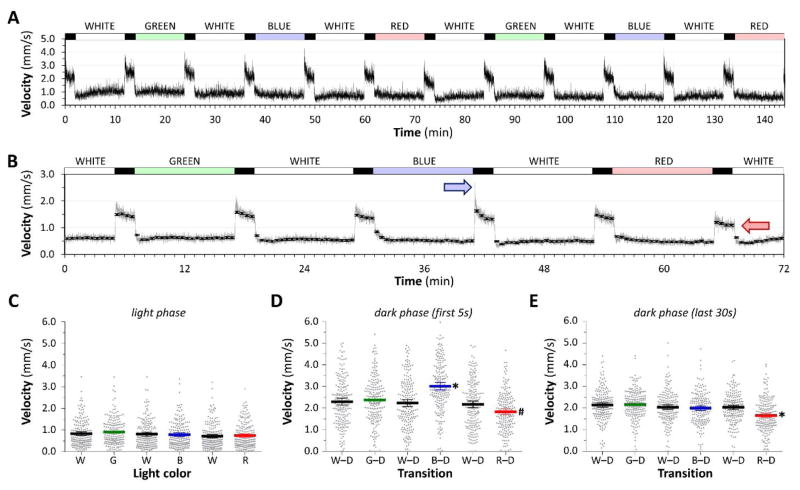
Figure 3. Quantitative differences in the visual motor response elicited with light of different wavelengths.
A: Group motor activity of 96 zebrafish in response to changes in illumination indicated above the trace. All light channels were calibrated to 450mW/m2.
B: Responses were averaged over two experiments of three complete stimulus cycles (white – green – white – blue – white – red). The gray line shows mean frame-by-frame activity; the black markers show mean ± 2SE values for 30-second time bins. Colored arrows indicate the prominent O-bend response after blue light and the attenuated dark response following red light.
C, D, E: Scatter plots showing 192 individual zebrafish responses, each averaged over three stimulus cycles. Large colored bars show population mean ± 2SE. C: motor activity during minutes 2 – 8 of illumination in each light segment of the cycle; D: motor activity in the first 5 seconds after each light-dark transition of the cycle; E: motor activity in the final 30 seconds of each dark segment of the cycle. *p<0.0001, #p<0.01 compared with all other groups, 1-way ANOVA with Tukey post hoc test.

