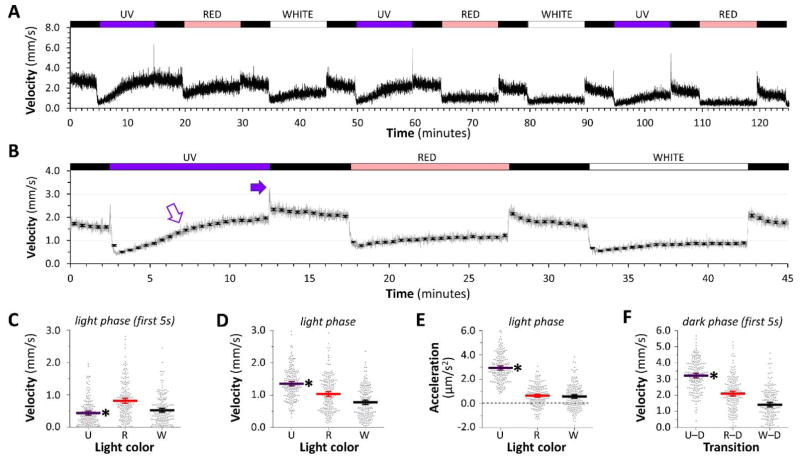
Figure 4. Visual motor response elicited by UV light.
A: Group motor activity of 96 zebrafish in response to changes in illumination indicated above the trace. UV and red channels were calibrated to 300mW/m2; for comparison the white channel was calibrated to 150mW/m2.
B: Responses were averaged as shown in figure 3B. Closed arrow indicates the prominent O-bend response after UV light; open arrow shows increasing motor activity during UV illumination.
C, D, E, F: Scatter plots showing 192 individual zebrafish responses, each averaged over three cycles of light stimuli. The large bars show the population mean ± 2SE. C: motor activity in the first 5 seconds after each dark-light transition; D: motor activity during minutes 2 – 8 of illumination in each light segment of the cycle; E: mean acceleration during each light segment of the cycle; F: motor activity in the first 5 seconds after each light-dark transition. *p<0.0001 compared with both other groups, 1-way ANOVA with Tukey post hoc test.

