
Fig. 1.
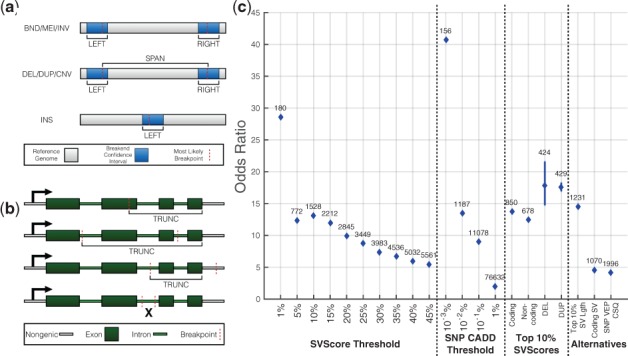
SVScore strategy and performance. (a) LEFT, RIGHT and SPAN intervals chosen by SVScore based on SV type. LEFT and RIGHT scores comprise the entire confidence interval (CI) around the left and right breakpoint, respectively, and are calculated for every variant type. Here, MEI refers specifically to mobile element insertions detected in the reference genome, whereas INS refers to all insertion types detected in the experimentally sequenced genome. For deletions (DEL), tandem duplications (DUP) and other copy number variants (CNV), a SPAN score is calculated using the interval between the most likely breakpoints. (b) Truncation scores (LTRUNC when truncated by the left breakend and RTRUNC otherwise) are calculated for deletions, inversions (INV), mobile element insertions (MEI) and INS variants that are predicted to truncate a transcript. (c) Above each point is the number of rare, pathogenic variants using the pathogenicity definition on the x-axis. The SVScore Threshold section shows the odds ratios for pathogenic SVs being rare under varying definitions of pathogenicity based on impact score percentile, where variants in the bottom 50% were considered benign. The SNP CADD Threshold section shows odds ratios calculated for SNPs using CADD at the percentile thresholds shown. For these odds ratios, SNPs with CADD scores in the bottom 50% were used as benign variants. Pathogenic variants used for calculations in the Top 10% SVScores section were all subsets of those SVs with impact scores in the top 10%. In this section, the variants in the bottom 50% of all impact scores were again called benign. For the ‘Coding’ and ‘Noncoding’ experiments, the pathogenic variants were those SVs in the top 10% of impact scores that did and did not overlap a refGene exon, respectively. In the ‘DEL’ and ‘DUP’ experiments, the pathogenic variants were DELs and DUPs, respectively, in the top 10% of scores. The size distributions of these variants were matched as described in Supplementary Methods, and the 95% confidence intervals are shown. The Alternatives section shows three odds ratios from SVScore alternatives. In the ‘Top 10% SV Lgth’ experiment, pathogenic variants were those with lengths at or above the 90th percentile, and benign variants were those below the 50th percentile. For ‘Coding SV’, pathogenic variants were those with at least one overlap between refGene exon and either a breakpoint CI or a SPAN interval, and benign variants were all others. The ‘SNP VEP CSQ’ experiment used VEP’s IMPACT predictions for SNPs—variants with at least one HIGH prediction on a canonical transcript were called pathogenic, while those with only LOW or MODIFIER predictions on canonical transcripts were categorized as benign. BND—‘unclassified’ structural variant