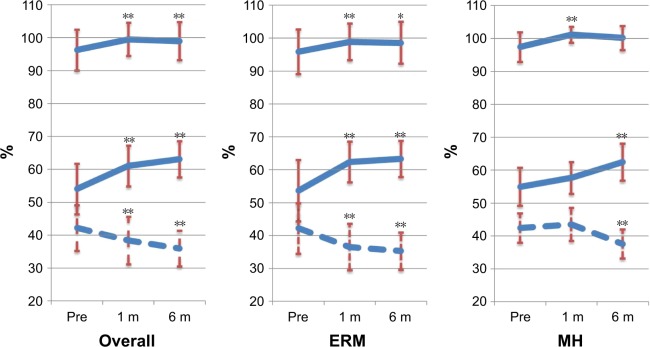
Figure 2.
Oxygen saturation in major retinal vessels before the surgery and 1 month and 6 months after the surgery.
Notes: Left graph: overall subjects; center graph: ERM subject; right graph: MH subject. Upper solid line: arterial saturation; middle solid line: venous saturation; lower broken line: A-V difference. *P<0.05, **P<0.01 compared before surgery.
Abbreviations: ERM, epiretinal membrane; MH, macular hole; A-V, arteriovenous; m, months.

