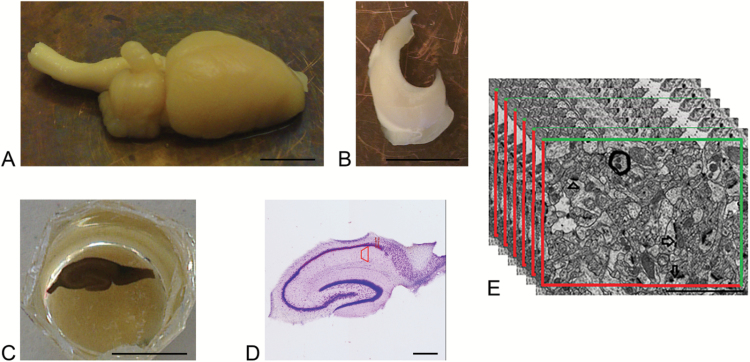
Figure 2.
Schematic illustration of tissue processing of sections for studying under electron microscopy. (A) Rat brain hemisphere, scale bar 5.5 = mm. (B) Isolated rat hippocampus, scale bar 5.5 = mm. (C) Epon block containing osmium tetroxide stained hippocampal section of thickness 65 µm, scale bar = 5.5 mm. (D) 65-µm-thick-Nissl stained vibratome section with trapezoid-shaped area of interest, scale bar = 0.55 mm. (E) Disector electron micrographs from CA1.SR hippocampal subregion with the 2D unbiased counting frame for counting the number of perforated spine synapses (arrow), nonperforated spine synapses (arrowhead). Scale bar = 2 µm.

