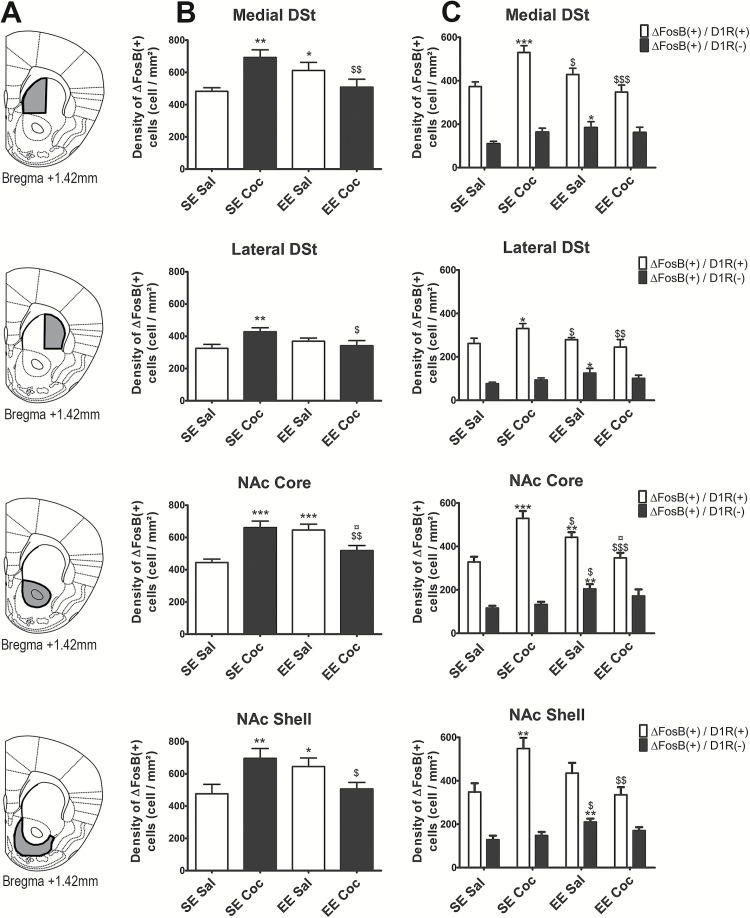
Figure 3.
Density of ΔFosB(+) cells in the striatum of standard environment (SE) Sal, SE Coc, enriched environment (EE) Sal, and EE Coc mice and characterization of the phenotype of these cells (D1 receptor [D1R](+) or D1R(-)). (A) Delimitations of the 4 striatal subregions (medial dorsal striatum [DSt], lateral DSt, nucleus accumbens [NAc] core and shell) used for quantification. (B) Density of ΔFosB(+) cells in each subregion. (C) Density of ΔFosB(+)/D1R(+) cells (white bars) and ΔFosB(+)/D1R(-) cells (black bars) in each subregion. Cocaine treatment significantly increased the density of ΔFosB(+)/D1R(+) MSNs in the 4 regions. EE significantly increased the density of ΔFosB(+)/D1R(-) cells in the medial and lateral DSt and NAc shell. In the NAc core, EE significantly increased the density of both ΔFosB/D1R(+) in and ΔFosB(+)/D1R(-) cells. The density of ΔFosB/D1R(+) and ΔFosB(+)/D1R(-) cells were similar in EE Coc and SE Sal animals. Results are expressed as means±SEM (n=8–10/group). We used Fisher’s protected least-squares difference posthoc test: * P<.05, ** P<.01, and *** P<.001, difference compared with SE Sal; $ P<.05, $$ P<.01, and $$$ P<.001, difference compared with SE Coc; ¤ P<.05, difference compared with EE Sal.

