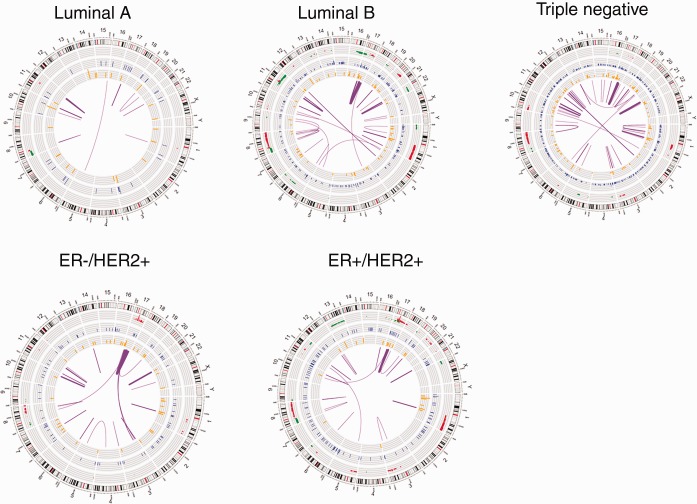
Figure 2.
Circos plots of mutations in clinical molecular breast cancer subtypes. This plot depicts the human chromosomes arranged in a circular pattern, with individual chromosomes represented as sections. From outside to inner side: The outermost track represents the copy number alteration (CNA), amplification in red, and deletion in green); the second track presents somatic single-nucleotide variants (SNVs) identified in whole-exome sequencing data (blue); the third track is RNA nonsynonymous tumor-specific expressed SNV(eSNVs; orange). The radius height in the outer three tracks represents the CNA ratio across the samples of this subtype. The innermost arches (purple) are the fusions; the two ends of an arch indicate the location of the two fused genes, and the thickness of the arch is proportional to the frequency of the fusion.

