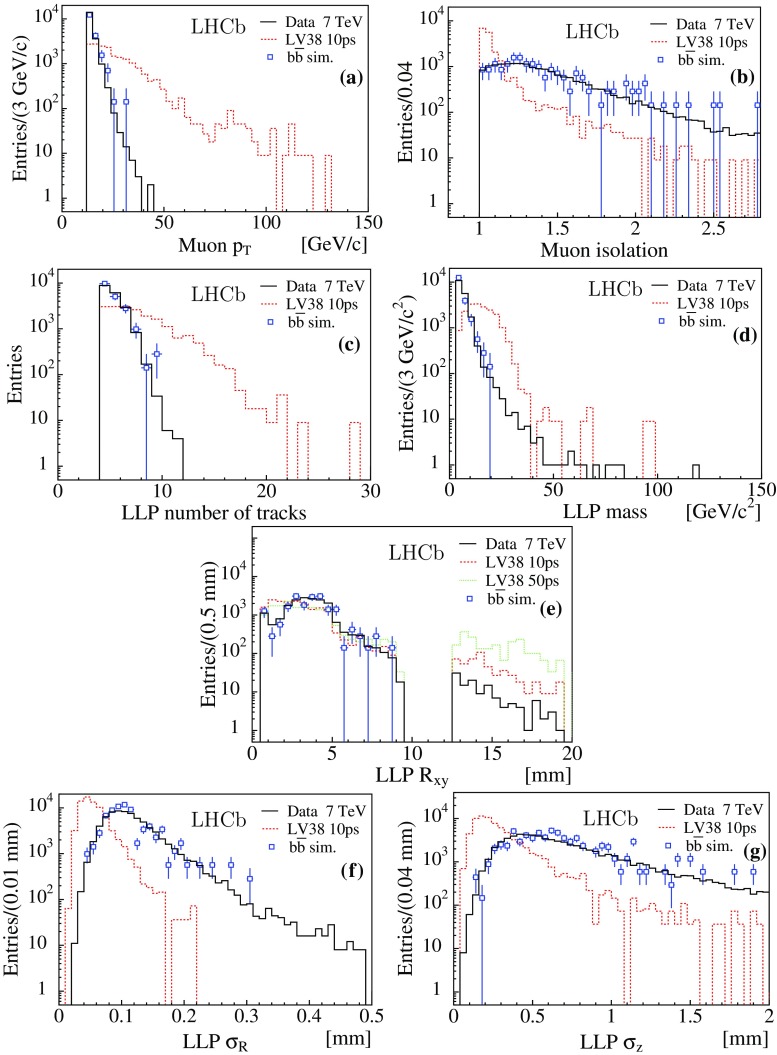
Fig. 2.
Distributions for the 7 TeV dataset (black histogram) compared to simulated events (blue squares with error bars), showing a transverse momentum and b isolation of the muon, c number of tracks of the displaced vertex, d reconstructed mass, e radial position of the vertex, f, g vertex fit uncertainties in the radial and z direction. The fully simulated signal distributions for LV38 10 ps are shown (red dashed histograms), as well as LV38 50 ps (green dotted histogram) in (e). The distributions from simulation are normalised to the number of data entries

