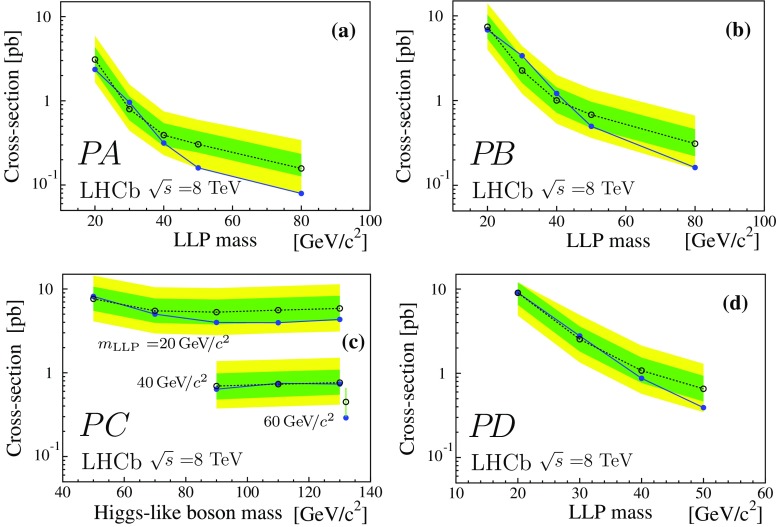
Fig. 5.
Expected (open dots and 1 and 2 bands) and observed (full dots) cross-section times branching fraction upper limits (95% CL) for the processes indicated in the bottom left corner of each plot, is always 10. The results correspond to the 8 TeV dataset. a Upper limits as a function of the LLP mass for process ; b as a function of the LLP mass for process , with ; c as a function of for process for of 20, 40, and 60 , from top to bottom (the single point at 130 with has been shifted to the right for visualisation); d upper limits as a function of the LLP mass for process with

