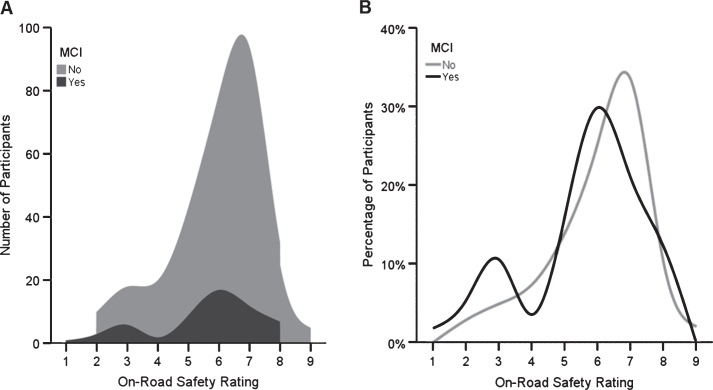
Fig.1.
Overlapping distributions of on-road safety ratings. Left panel shows spline smoothed stacked area histogram of frequency as a function of on-road test safety rating and cognitive impairment category (black: Mild Cognitive Impairment; grey: Cognitively Normal). Right panel shows line graph of percentage of cognitively impaired (black line) and cognitively normal (grey line) participants as a function of on-road test safety rating.

