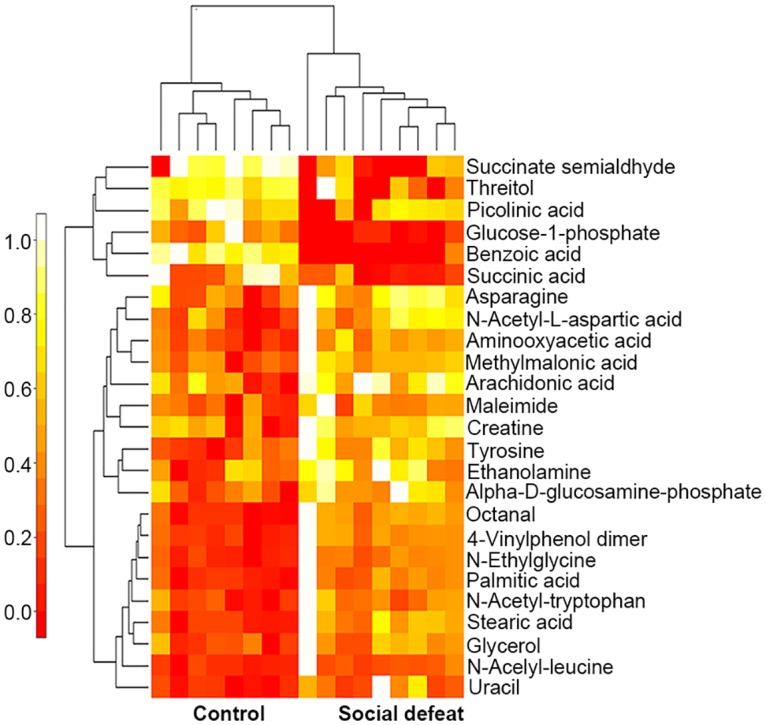
Fig 4. Heatmap visualization of metabolomics data for the prefrontal cortex.

The heatmap was constructed based on the differential metabolites. The data of heatmap were normalized by rescaling between 0 and 1. Distinct segregation was observed between control and socially defeated rats. Rows: metabolites; columns: samples. Color key indicates metabolite expression value: white, highest; red, lowest.
