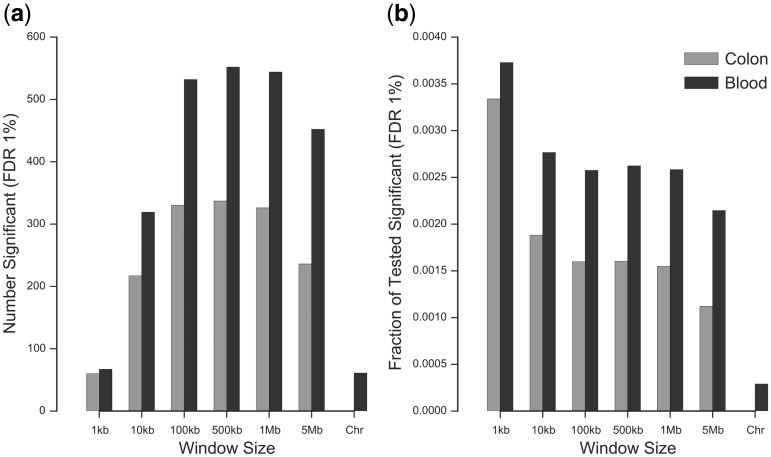
Figure 1.
Summary of popDNAm sites across both tissues considered. We plot the numbers of sites with significant effects of local ancestry (FDR 1%) for different window sizes used for local ancestry estimation. Specifically, we show the absolute number of popDNAm sites (A) and the number of popDNAm sites as the fraction of sites tested for a specific window size (B).

