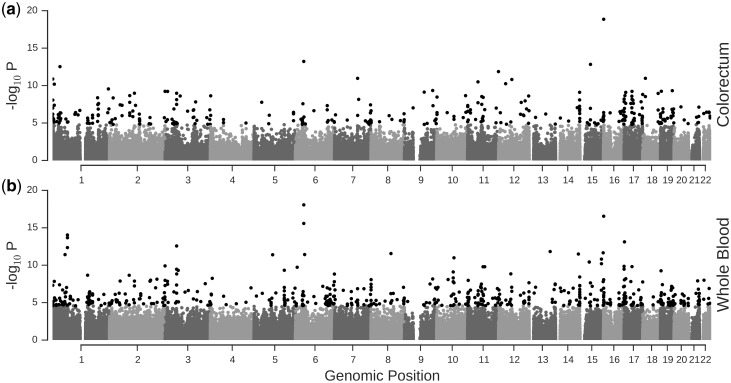
Figure 2.
Distribution of identified popDNAm sites in the genome. We plot –log10 P value of the likelihood ratio test for presence of effects of local ancestry proportions in a 500kb for each tested DNAm site in colorectum (A) and whole blood (B). Sites which are significant (FDR 1%) are shown in black.

