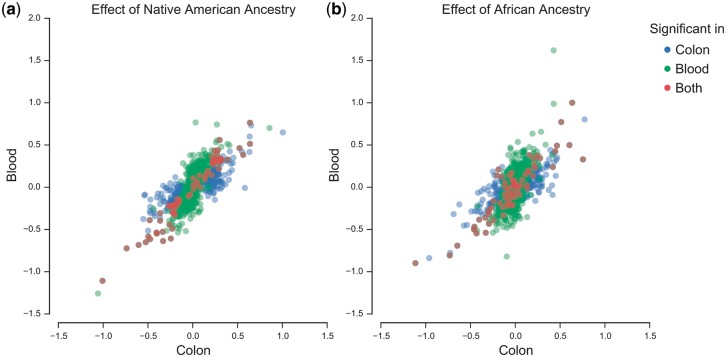
Figure 3.
Across tissue comparison of ancestral population effects at individual popDNAm sites. We plot the estimated effect of local Native American (A) and African (b) ancestry within a 500kb window in whole blood tissue (Blood) versus the effect in colorectal tissue (Colon). Effects are only plotted for sites which, for either tissue, were identified as popDNAm sites based on local ancestry in the 500kb window. Colour indicates for which tissue a specific site was identified as exhibiting popDNAm.

