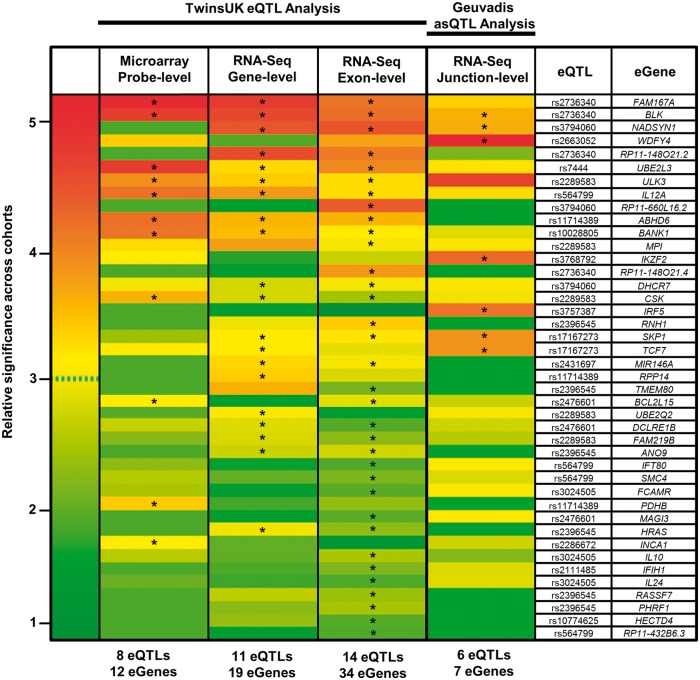
Figure 1.
Heatmap of candidate-causal eQTLs and eGenes detected across the four expression-quantification types. Relative association P-values are shown. If a candidate-causal association (marked *) is identified in at least one quantification type, then the P-value is shown for all quantifications (no * means the association is not candidate-causal). Rows are ordered by decreasing cumulative significance. To normalize across quantification types, relative significance of each association per column was calculated as the –log2 (P/Pmax); where Pmax is the most significant association per quantification type. Data used for heatmap are found in Supplementary Materials, Tables S2, S3, S4, S8 for microarray, gene-level, exon-level, and splice-junction level eQTL analysis respectively.

